The Home tab in your Sonar portal provides quick access to key data and frequently viewed information, streamlining your organization's management.
Key Components of the Manage Organization Home tab
The Home tab has 4 main components, designed to give Office Managers a quick snapshot of their organization's call structure and usage.
- Call Graph
- Current Active Calls
- Users and Applications
- Usage Stats
Current Active Calls
The Current Active Calls section displays all ongoing calls within your organization, including:
- Extension or caller ID
- Caller’s name
- Dialed number
- Recipient
- Duration of the call

If you notice the duration of a call has stopped, you may need to refresh the page for Sonar to recognize that a call has ended.

Call Graph
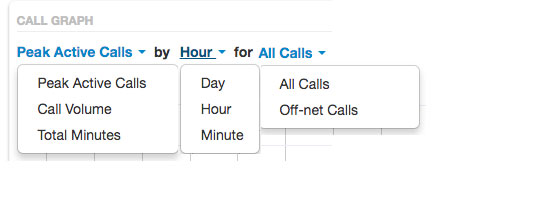
The Call Graph offers a quick way to visualize your company’s call data. You can adjust the time period and data you want to view, such as:
- Peak active calls
- Call volume
- Total minutes

Graphs can be filtered by day, hour, or minute, and you can choose to display all calls or just off-net calls.
Quick Zoom: Instantly zoom in on the current hour, day, or week for a more detailed view.
Print Page: Save your current graph by choosing to print or save to PDF.

Below the main graph, there’s a smaller graph with adjustable sliders that allow you to fine-tune the start and end dates or times displayed in the main graph.
- By Day
- By Week
- By Hour

Users, Applications and Usage Stats
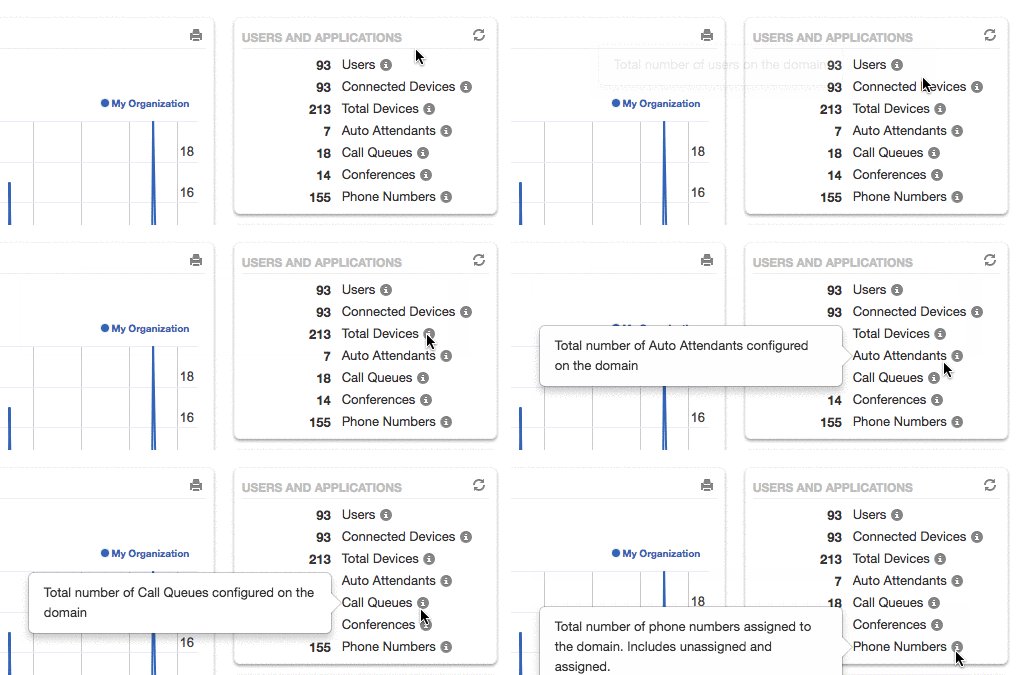
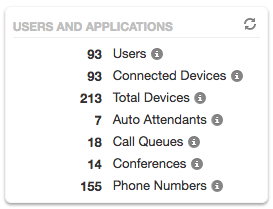
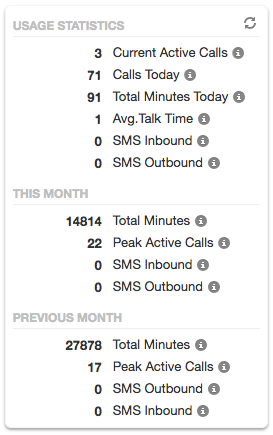
On the right side of the Home tab, you’ll find key figures related to your organization’s users, devices, and usage statistics. For more details on any figure or statistic, simply hover over the information icon next to it for a brief description.

Users and Applications: Displays a headcount of users and devices.

Usage Stats: Shows current, monthly, and last month’s statistics.

